National Aeronautics and Space Administration
Goddard Space Flight Center
Search:

Balloon Program Office
Operational Capabilities
Fort Sumner Launch of 699N - BITSE/WASP on a 39 MCF - 18 Sept 2019
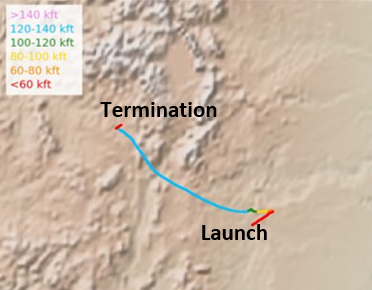
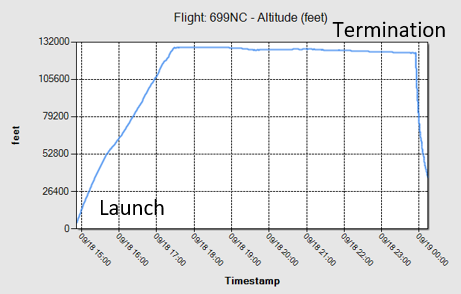
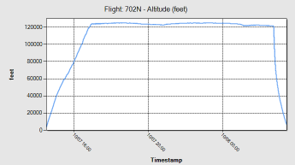
Depicted above is a westward trajectory out of a launch from Fort Sumner in early October. The colors tracing the trajectory course in the image above correspond to balloon altitude. The graph shows the balloon's altitude on an hourly basis from launch to termination.
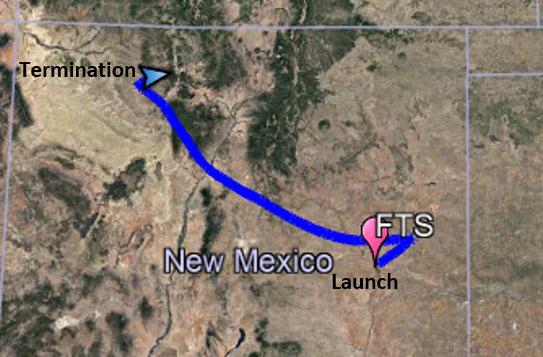
The westward trajectory depicted from the Fort Sumner launch site is typical for early to mid-September when stratospheric winds blow from east to west.
NASA Code 820
Scientific Balloon Update
Report back for the latest update from NASA's Balloon Program Office.
- NASA Official: Debora Fairbrother
- Point of Contact: Valerie Brizak